
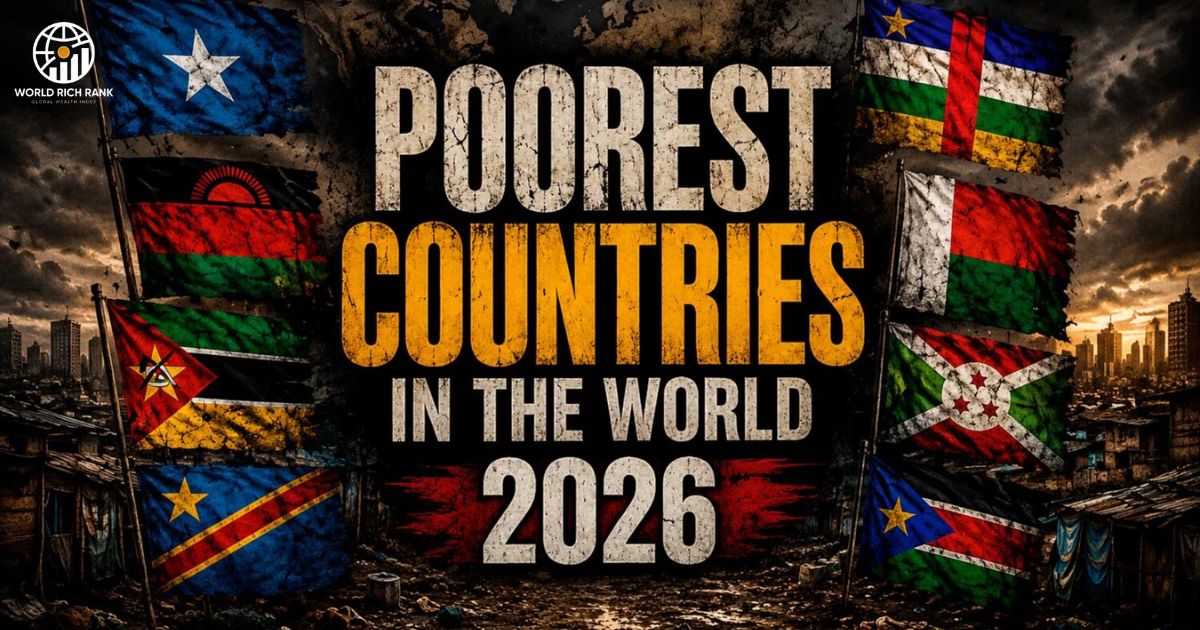
Poverty remains a major challenge in several parts of the world, particularly in countries affected by conflict, limited infrastructure, weak institutions, climate pressures, and restricted access to education and healthcare. In 2026, the poorest countries are generally concentrated in Sub-Saharan Africa, where low income levels and economic instability continue to affect living standards. Measures such as GDP per capita, purchasing power, employment, and household income are commonly used to understand the scale of poverty.
However, being classified as a “poor country” does not mean that every person living there is poor. National economic statistics represent broad averages and can hide significant differences between communities and regions. Some countries also have valuable natural resources and strong growth potential but continue to face difficulties because of political instability, inadequate infrastructure, debt, or unequal distribution of wealth. Looking at these wider factors provides a more balanced understanding of global poverty in 2026.
Trending Today ; Top 10 Best English-Speaking Countries to Live and Move in 2026
Key findings
- Sub-Saharan Africa remains home to many of the world’s lowest-income countries.
- Conflict and political instability can severely disrupt economic growth and investment.
- Limited infrastructure restricts access to education, healthcare, transportation, and markets.
- Low productivity and unemployment can keep household incomes below global averages.
- Climate change and natural disasters can place additional pressure on vulnerable economies.
- Economic development depends on factors including education, investment, stable institutions, infrastructure, and access to international markets.

Top 10 Poorest Countries in the World
The countries listed below are among the world’s lowest-income economies, based broadly on income per person and wider economic conditions. Their positions can vary depending on whether GDP per capita, GNI per capita, or purchasing-power measures are used.
| Rank | Country | Nominal GDP per capita, 2026 | GDP per capita PPP, 2026 | GNI per capita, latest | Extreme poverty rate, latest | HDI, 2023 |
|---|---|---|---|---|---|---|
| 1 | Yemen | $384 | $1,596 | $740 (2018) | 33.3% (2014) | 0.470 |
| 2 | South Sudan | $488 | $1,540 | $1,050 (2015) | 76.5% (2016) | 0.388 |
| 3 | Burundi | $546 | $1,031 | $240 (2025) | 74.2% (2020) | 0.439 |
| 4 | Central African Republic | $613 | $1,468 | $560 (2025) | 71.6% (2021) | 0.414 |
| 5 | Mozambique | $632 | $1,699 | $570 (2025) | 81.4% (2022) | 0.493 |
| 6 | Madagascar | $656 | $2,106 | $560 (2025) | 69.2% (2021) | 0.487 |
| 7 | Malawi | $733 | $1,797 | $600 (2025) | 75.4% (2019) | 0.517 |
| 8 | Somalia | $813 | $1,956 | $640 (2025) | No comparable data | 0.404 |
| 9 | Niger | $822 | $2,232 | $750 (2025) | 60.5% (2021) | 0.419 |
| 10 | Sudan | $864 | $2,451 | $900 (2025) | 10.1% (2014) | 0.511 |
1. Yemen
Yemen faces severe economic hardship after years of conflict and political instability. Damage to infrastructure, disruptions to trade, and shortages of essential services have weakened economic activity and made everyday life increasingly difficult for many households.
The conflict has also affected employment, investment, food security, healthcare, and education. Large numbers of people depend on humanitarian assistance, while disruptions to agriculture and supply chains add pressure to household incomes.
Economic recovery remains closely connected to greater political stability and rebuilding. Restoring infrastructure, expanding employment opportunities, improving public services, and supporting private-sector activity will be important for reducing poverty over the longer term.
2. South Sudan
South Sudan continues to face major economic challenges linked to political instability, conflict, weak infrastructure, and dependence on oil revenues. Limited economic diversification leaves the country vulnerable to changes in oil production and prices.
Flooding, food insecurity, and displacement can further disrupt agriculture and livelihoods. Expanding infrastructure, improving access to education and healthcare, and creating more opportunities outside the oil sector could help strengthen long-term economic development.
3. Burundi
Burundi remains one of the world’s lowest-income economies, with a large share of the population dependent on agriculture. Low productivity, limited industrial development, and restricted access to infrastructure contribute to low household incomes.
Population growth, food insecurity, and limited employment opportunities create additional pressure. Greater investment in agriculture, education, infrastructure, and private businesses could help improve productivity and create more sustainable sources of income.
4. Central African Republic
The Central African Republic faces persistent poverty partly because of political instability, conflict, and inadequate infrastructure. Limited access to roads, electricity, healthcare, and other essential services makes economic activity difficult, particularly outside major population centers.
Agriculture provides livelihoods for much of the population, but productivity remains constrained by infrastructure and security challenges. Greater stability and investment could help expand trade, strengthen agricultural production, and improve living standards.
5. Mozambique
Mozambique has significant natural resources and agricultural potential, yet poverty remains widespread. Economic development has been affected by regional insecurity, climate-related disasters, infrastructure gaps, and unequal access to economic opportunities.
Cyclones, floods, and droughts can damage crops, homes, and infrastructure, placing additional pressure on vulnerable communities. Diversifying the economy and improving education, transportation, energy access, and employment could support broader and more sustainable growth.
6. Madagascar
Madagascar has substantial agricultural and natural resources, but many people continue to live on low incomes. Limited infrastructure, vulnerability to extreme weather, and dependence on agriculture make many communities particularly exposed to economic shocks.
Cyclones and droughts can damage crops and disrupt livelihoods, while inadequate transportation can make it harder for farmers to reach markets. Investment in resilient infrastructure, education, agriculture, and sustainable industries could help reduce poverty.
7. Malawi
Malawi’s economy relies heavily on agriculture, making household incomes vulnerable to droughts, floods, changing weather patterns, and fluctuations in agricultural production. Limited industrial development also restricts the availability of higher-paying employment.
Food security and access to essential services remain important development concerns. Improving agricultural productivity, expanding irrigation, strengthening infrastructure, and creating opportunities in manufacturing and services could support higher incomes.
8. Somalia
Somalia faces deep economic challenges associated with prolonged instability, climate shocks, limited infrastructure, and restricted access to basic services. Droughts and floods can have particularly severe effects because many households depend on livestock and agriculture.
Despite these difficulties, Somalia has opportunities for economic development through trade, telecommunications, livestock, fisheries, and private enterprise. Greater stability, investment, and access to financial and public services could help strengthen livelihoods.
9. Niger
Niger is heavily dependent on agriculture and pastoral activities, sectors that are highly vulnerable to drought and other environmental pressures. Rapid population growth, limited infrastructure, and restricted access to education and healthcare also contribute to persistent poverty.
The country has natural resources and significant potential for agriculture and renewable energy. Expanding education, improving water and transport infrastructure, increasing agricultural productivity, and diversifying economic activity could create stronger foundations for future development.
10. Sudan
Sudan’s economy has been severely affected by conflict, political instability, displacement, and disruption to trade and production. Damage to infrastructure and interruptions to agriculture and other economic activities have placed additional pressure on incomes and access to essential goods.
Sudan also has considerable agricultural potential and natural resources, but realizing that potential depends heavily on stability and reconstruction. Restoring basic services, rebuilding infrastructure, supporting agriculture, and creating conditions for private investment will be important for long-term recovery.
Sources: World Bank, International Monetary Fund (IMF), United Nations Development Programme (UNDP), and other reputable international economic and development databases.
Data notes: Poverty rankings can change depending on the indicator used and the year of available data. GDP or GNI per capita is useful for comparing average economic output or income, but it does not fully capture inequality, household living standards, informal economic activity, or differences in purchasing power. Figures and rankings should therefore be treated as broad economic comparisons rather than exact measures of individual poverty.
What Is the Poorest Country in the World?
Determining the poorest country in the world depends on the economic measure being used. GDP per capita and GNI per capita are among the most common indicators because they show the average level of economic output or income per person. By these measures, countries such as Yemen, South Sudan, Burundi, and the Central African Republic frequently appear among the world’s lowest-income economies, although their exact positions can change as new data becomes available.
Yemen is often highlighted because years of conflict and political instability have severely damaged its economy. Infrastructure, businesses, employment, trade, and essential public services have all been affected. However, economic rankings can be difficult to establish for countries experiencing conflict because reliable and up-to-date economic data may be limited.
It is also important to distinguish between a country’s average income and the actual living conditions of its population. A low GDP or GNI per person does not necessarily mean every resident has the same level of hardship. Poverty is also influenced by inequality, access to healthcare and education, food security, employment, infrastructure, and the cost of living. For this reason, identifying the “poorest country” provides only one perspective on global poverty and economic well-being.
But “poorest” does not have a single universal definition:
| Measurement | Country at or near the bottom | What the result means |
| Nominal GDP per capita, 2026 | Yemen | Lowest projected economic output per person at market exchange rates |
| GDP per capita PPP, 2026 | Burundi | Lowest projected output after adjusting for differences in local prices |
| Extreme-poverty rate, latest survey | DR Congo / Mozambique among countries with available data | A very high share of the population lives below the specified international poverty threshold |
| Human Development Index, 2023 | South Sudan | Lowest combined outcome across health, education, and income |
How the Poorest Countries Are Ranked
There is no single measure that determines which country is the poorest. Researchers commonly compare countries using income and economic output measures such as nominal GDP per capita, GDP per capita based on purchasing power parity (PPP), and GNI per capita. Poverty rates and multidimensional measures add further context by showing how many people face financial hardship or lack access to essential services. Each indicator captures a different part of economic well-being, so rankings can change depending on the method used.
Nominal GDP per capita
Nominal GDP per capita measures a country’s economic output per person using current market exchange rates. It is calculated by dividing total GDP by the population, making it useful for comparing the size of economic output per person in commonly used currency terms.
GDP per capita = GDP ÷ population
It can help identify countries with very low average economic production, but it does not directly show how much people can afford or how evenly income is distributed.
- Measures economic output: It shows the average amount of domestic production associated with each person.
- Uses market exchange rates: International comparisons are generally converted into a common currency.
- Helps rank economies: Countries with very low output per person may appear near the bottom of global rankings.
- Does not measure inequality: A country can have low average GDP while income is distributed very differently across households.
- Does not fully measure living standards: Healthcare, education, housing, prices, and access to basic services are not captured directly.
GDP per capita PPP
GDP per capita PPP adjusts economic output for differences in prices between countries. Instead of simply converting currencies using market exchange rates, PPP attempts to reflect how much goods and services can actually be purchased locally. This makes it particularly useful when comparing living standards across economies with very different price levels.
A country may have a very low nominal GDP per capita but rank somewhat higher when PPP is used because everyday goods and services can be cheaper locally. Conversely, countries with higher domestic prices may look less favorable under a purchasing-power comparison.
PPP is still an average measure rather than a direct measurement of household poverty. It does not fully capture inequality, access to public services, or differences in the quality of goods and services. Therefore, PPP is best used alongside other poverty and development indicators.
GNI per capita
GNI per capita measures the average income earned by a country’s residents rather than only the value of production occurring inside its borders. It includes income received from abroad and subtracts certain income paid to foreign residents. The World Bank commonly uses GNI per capita, converted through its Atlas method, for international income classifications.
GNI per capita can provide a useful view of the income available to residents, but it also has limitations. Informal or subsistence economic activity may be difficult to capture, while the national average does not reveal how income is distributed among households.
Poverty rate
The poverty rate measures the share of a population living below a specified poverty threshold. Because countries can use different national poverty lines, international comparisons often rely on a common poverty line adjusted using PPP.
Poverty rates have limitations of their own:
- Different poverty lines: National thresholds can vary considerably between countries.
- Data gaps: Some countries do not conduct household surveys frequently enough for current estimates.
- Does not show poverty intensity: Two countries can have similar poverty rates while the depth of poverty differs.
- Limited view of non-monetary hardship: Income measures may miss poor access to healthcare, education, sanitation, or electricity.
- Survey differences: Collection methods, dates, and coverage can affect comparisons between countries.
Multidimensional Poverty Index
The Multidimensional Poverty Index (MPI) looks beyond income by measuring several forms of deprivation that affect people’s everyday lives.
- Health: Looks at important health-related deprivations.
- Education: Considers access to schooling and educational attainment.
- Standard of living: Includes factors such as housing conditions, sanitation, drinking water, electricity, and other basic services.
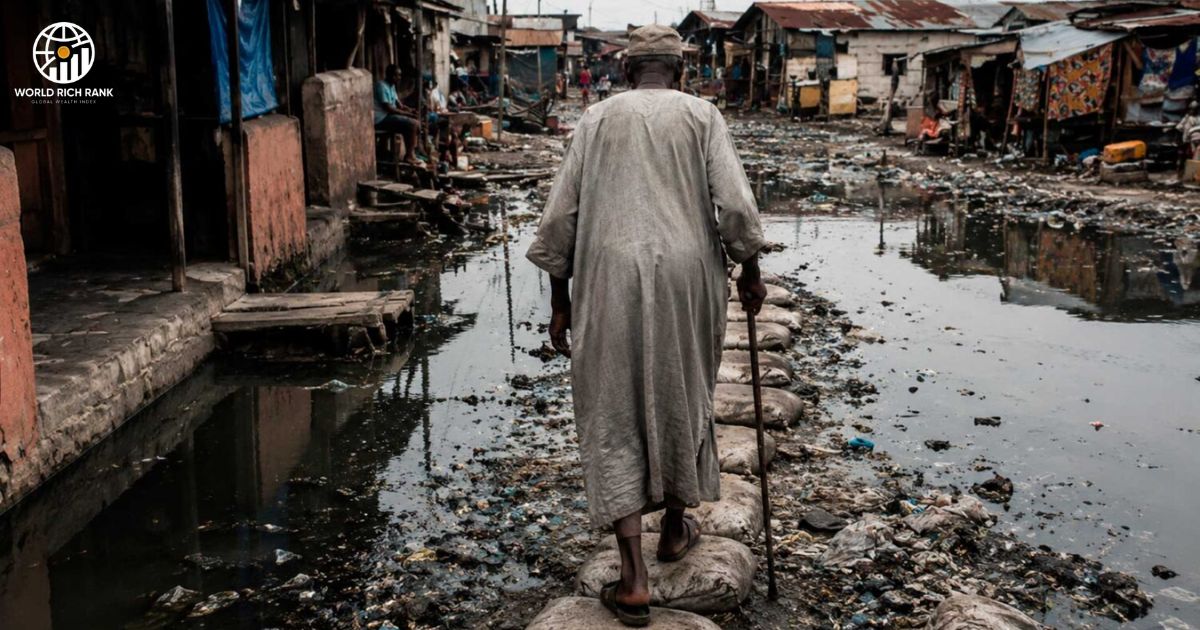
The MPI is useful because poverty is not simply a question of how much money a household earns. A family may have a low income while also facing poor access to education, healthcare, clean water, sanitation, electricity, or adequate living conditions. The global MPI combines the incidence of multidimensional poverty with its intensity, giving a broader picture of deprivation than income alone.
Overall, the ranking of the world’s poorest countries should be interpreted carefully. Nominal GDP per capita focuses on economic output, PPP-adjusted GDP per capita accounts for differences in purchasing power, GNI per capita focuses more directly on national income, while poverty rates and MPI provide additional information about people’s actual living conditions. Using several measures together produces a more balanced picture of poverty and economic well-being.
Why Are the Poorest Countries Poor?
The poorest countries usually face several connected economic and social challenges rather than one single cause. Conflict, weak institutions, limited infrastructure, low agricultural productivity, poor access to education and healthcare, rapid population growth, climate shocks, high debt, and restricted access to finance can all slow economic development. These problems can reinforce one another, making it difficult for governments, businesses, and households to build stable and productive economies.
Conflict and political instability
Conflict and political instability can severely damage an economy by destroying infrastructure, disrupting trade, reducing investment, and forcing people to leave their homes. Businesses may close, government services can weaken, and resources that could support development are redirected toward security and emergency needs. Prolonged instability also makes foreign investors and skilled workers less likely to commit to the country.
Weak institutions
Weak institutions can make it difficult for a country to manage its economy effectively. When public administration, courts, regulatory systems, and government agencies lack capacity, businesses may face uncertainty and citizens may struggle to access essential services. Poor governance can also make long-term development projects harder to plan and complete.
Another problem is that weak institutions can reduce public trust and discourage private investment. If property rights are uncertain, contracts are difficult to enforce, or corruption increases the cost of doing business, entrepreneurs may avoid investing or keep businesses informal. This limits tax revenue, job creation, and economic growth.
Dependence on low-productivity agriculture
Many poor economies depend heavily on small-scale agriculture for employment and household income. Farmers may have limited access to modern equipment, irrigation, quality seeds, storage, transportation, and financial services. Low productivity means that workers can spend large amounts of time producing relatively little economic value, while droughts, floods, and changing weather patterns can further reduce incomes.
Inadequate infrastructure
Poor roads, unreliable electricity, limited internet access, and inadequate water and sanitation systems can make economic activity much more expensive. Farmers may struggle to move products to markets, while businesses can face higher transportation and operating costs. Remote communities may also remain disconnected from schools, hospitals, banks, and employment opportunities.
Infrastructure shortages can create a cycle that is difficult to break. Without reliable infrastructure, companies may be reluctant to establish factories or expand operations, while governments with limited revenues may struggle to finance major infrastructure projects. Improving transport, energy, digital connectivity, and basic utilities can therefore play an important role in long-term development.
Limited access to education and healthcare
Limited access to quality education and healthcare reduces human capital and makes it harder for people to obtain productive, well-paid employment. Children who cannot complete school may have fewer opportunities later in life, while poor healthcare can reduce workers’ ability to participate consistently in the economy. These disadvantages can pass from one generation to the next.
Rapid population growth
Rapid population growth can place additional pressure on housing, schools, healthcare systems, food supplies, jobs, and public infrastructure. If employment and economic output do not grow quickly enough to keep pace with the population, average incomes may remain low. A large young population can eventually become an economic advantage, but only when sufficient education, skills, and jobs are available.
Climate and environmental shocks
Droughts, floods, storms, extreme heat, and other environmental shocks can have a particularly strong impact on poorer countries because households and governments often have fewer resources to recover. Agricultural losses can reduce food supplies and incomes, while disasters can destroy roads, homes, schools, and businesses. Repeated climate shocks can consume resources that might otherwise be invested in long-term development.
Debt and restricted access to finance
High debt can limit the amount of money governments have available for infrastructure, healthcare, education, and other development priorities. When a significant share of public revenue goes toward debt servicing, governments may have less flexibility to respond to economic downturns or emergencies. External financial pressures can become especially difficult when a country has limited foreign-exchange earnings.
Limited access to affordable finance also affects businesses and households. Entrepreneurs may struggle to obtain loans to start or expand companies, while farmers may lack credit for equipment, irrigation, or better inputs. Without sufficient investment capital, productive sectors can remain small and job creation can stay weak, making it harder for the economy to move toward higher-value industries.
Poorest Countries by Region
Poverty levels vary significantly across regions, and the country at the bottom of a regional ranking can change depending on the economic indicator and year used. The table below presents the lowest-ranked economy with available data in each major region, using projected nominal GDP per capita as a simple comparison of economic output per person.
| Region | Lowest-ranked economy with available data | Projected nominal GDP per capita |
| Africa | South Sudan | $488 |
| Asia and the Middle East | Yemen | $384 |
| Europe | Ukraine | $6,980 |
| Latin America and the Caribbean | Haiti | $3,079 |
| Oceania | Solomon Islands | $2,258 |
Sources
The figures can be compared with data from organizations such as the World Bank, International Monetary Fund (IMF), and United Nations. These organizations publish economic and development statistics that are commonly used to assess income, output, poverty, and living standards across countries.
Nominal GDP per capita is useful for showing the approximate economic output associated with each person, but it should not be treated as a complete measure of poverty. Exchange rates can cause substantial differences in nominal comparisons, and the measure does not account for local purchasing power, income inequality, or access to essential services.
Regional rankings should therefore be interpreted as a snapshot rather than a permanent classification. Economic conditions can change because of conflict, inflation, population changes, natural disasters, commodity prices, investment, and policy reforms. A country with low GDP per capita may also have different living conditions from another country with a similar income level.
How the Ranking Has Changed
The countries appearing at the bottom of the global income rankings have changed over time as economies have faced different combinations of conflict, economic shocks, population growth, natural disasters, and changes in production. The table below shows how the three lowest nominal GDP-per-capita positions have shifted between 2016, 2021, and the 2026 projections.
| Year | Lowest nominal GDP per capita | Second-lowest | Third-lowest |
| 2016 | South Sudan — $261 | Burundi — $263 | Malawi — $415 |
| 2021 | Burundi — $259 | Afghanistan — $356 | Mozambique — $504 |
| 2026 projection | Yemen — $384 | South Sudan — $488 | Burundi — $546 |
Sources: World Bank, International Monetary Fund (IMF), and United Nations economic and development databases. Figures and country positions can vary depending on the database, exchange-rate assumptions, revisions, and availability of national economic data.
Several points explain the changes:
- Economic growth differs: Countries grow at different rates, causing their positions to move up or down over time.
- Conflict can reduce output: Wars and political instability can damage infrastructure, businesses, trade, and employment.
- Currency movements matter: Nominal GDP per capita is affected by exchange rates, so currency depreciation can lower a country’s ranking.
- Population growth affects per-person figures: When population grows faster than economic output, GDP per capita can remain very low.
- Commodity prices influence economies: Countries dependent on oil, minerals, or agricultural exports can experience major changes when global prices shift.
- Data revisions can change rankings: New surveys, population estimates, exchange-rate updates, and revised national accounts can alter historical figures.
These changes show why the title of the “poorest country” should not be viewed as permanent. A country may rank near the bottom in one year because of a severe economic or political crisis and move later as conditions improve. Likewise, another country can fall down the ranking after conflict, natural disasters, currency weakness, or a prolonged slowdown.
It is also important to distinguish nominal GDP per capita from broader measures of poverty. Nominal figures are useful for comparing economic output at market exchange rates, but they do not show purchasing power, inequality, healthcare, education, or access to basic services. For a fuller picture of poverty, GDP per capita should be considered alongside PPP, GNI per capita, poverty rates, and multidimensional poverty measures.
Can the Poorest Countries Escape Poverty?
Yes, the poorest countries can reduce poverty and achieve stronger economic growth, but progress usually requires sustained improvements rather than a single solution. Countries that combine stability, investment, human development, productive jobs, and better institutions have greater opportunities to create lasting improvements in living standards.
The most effective route varies by country, but recurring priorities include:
- Political stability: Reduce conflict and create a safer environment for people and businesses.
- Stronger institutions: Improve governance, public administration, transparency, and the rule of law.
- Better education: Expand access to quality primary, secondary, vocational, and higher education.
- Accessible healthcare: Strengthen healthcare systems and improve basic health services.
- Infrastructure investment: Build reliable roads, electricity, water systems, transport networks, and digital connections.
- Agricultural productivity: Give farmers better technology, irrigation, financing, storage, and market access.
- Private-sector development: Make it easier for businesses to start, operate, invest, and create jobs.
- Economic diversification: Reduce excessive dependence on one commodity or economic sector.
- Access to finance: Expand affordable credit and financial services for households, farmers, and businesses.
- Climate resilience: Invest in systems that help communities withstand droughts, floods, heat, and other environmental shocks.
- International cooperation: Use trade, investment, development assistance, and technical support to strengthen long-term economic capacity.
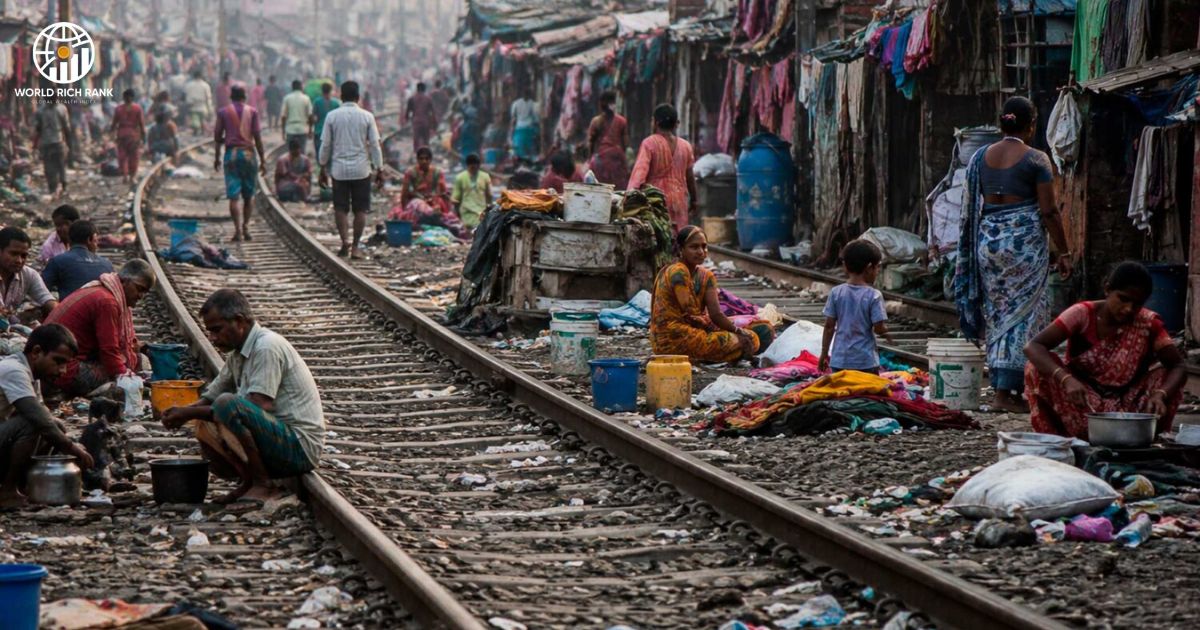
Reducing poverty becomes more achievable when economic growth reaches ordinary households. Creating productive employment, improving worker skills, supporting small businesses, and connecting rural communities to markets can help people increase their incomes rather than relying only on short-term assistance. Better infrastructure and education can also make future growth more sustainable.
However, progress can take many years, particularly in countries affected by conflict, weak institutions, or repeated economic and climate shocks. Successful poverty reduction therefore requires consistent policies, responsible investment, stronger institutions, and opportunities for people to participate in the economy. With these foundations in place, countries currently facing severe poverty can gradually improve productivity, incomes, and living standards.
Conclusion
The poorest countries in the world cannot be understood through a single number. Low incomes are often linked with conflict, weak institutions, limited infrastructure, low productivity, poor access to education and healthcare, climate risks, and restricted access to finance. Understanding these challenges together provides a clearer picture of why some economies remain at the bottom of global rankings and what policies can help them achieve sustainable progress.
The most reliable comparison therefore uses several indicators:
- Nominal GDP per capita: Measures economic output per person at market exchange rates.
- GDP per capita PPP: Adjusts comparisons for differences in local purchasing power.
- GNI per capita: Focuses on income received by a country’s residents.
- Poverty rate: Shows the proportion of people living below a defined poverty threshold.
- Multidimensional Poverty Index: Examines several forms of deprivation, including health, education, and living standards.
Together, these indicators provide a more balanced understanding of poverty than any single ranking. They also show that escaping poverty requires more than increasing national income—it depends on creating jobs, improving public services, strengthening institutions, investing in people, and building an economy that can withstand future shocks.
Sources and Methodology
This ranking uses a combination of internationally recognized economic and development indicators to provide a broader view of poverty. Sources such as the World Bank, International Monetary Fund (IMF), and United Nations Development Programme (UNDP) provide data on GDP, GNI, poverty, and multidimensional deprivation. Because economic data are revised and different indicators measure different aspects of poverty, rankings should be treated as comparative estimates rather than absolute labels.
- GDP per capita: Used to compare economic output per person across countries.
- Nominal GDP: Uses current market exchange rates and helps show differences in economic output in common currency terms.
- GDP per capita PPP: Adjusts for differences in local prices and purchasing power.
- GNI per capita: Measures income received by a country’s residents and is commonly used by the World Bank for income classifications.
- Poverty rate: Measures the share of people living below a defined poverty threshold, with international comparisons using common PPP-based poverty lines.
- Multidimensional Poverty Index: Considers overlapping disadvantages in health, education, and living standards rather than income alone.
- Historical comparisons: Previous-year figures are considered to show how rankings change because of economic growth, conflict, population changes, exchange rates, and data revisions.
- Data limitations: Estimates can differ because of survey years, missing information, methodological changes, exchange-rate movements, and revisions to national economic statistics.
Frequently Asked Questions
What is the poorest country in the world in 2026?
The answer depends on the indicator used. Countries such as Yemen, South Sudan, and Burundi are frequently found near the bottom of global income rankings. For 2026, projected nominal GDP per capita can place Yemen among the countries with the lowest output per person, although rankings may change as economic data are revised.
Which country has the lowest GDP per capita?
The country with the lowest GDP per capita can vary depending on whether nominal GDP or PPP-adjusted GDP is used. Yemen and South Sudan are among the countries commonly appearing near the bottom of nominal GDP-per-capita comparisons, while PPP rankings can produce a different order.
How are the poorest countries determined?
Poorest-country rankings are determined using indicators such as GDP per capita, GDP per capita PPP, GNI per capita, poverty rates, and the Multidimensional Poverty Index. Using several measures gives a more complete picture because economic output alone does not capture all aspects of poverty.
Why are some countries poorer than others?
Countries can remain poor because of a combination of conflict, political instability, weak institutions, limited infrastructure, low productivity, inadequate education and healthcare, rapid population growth, climate shocks, and restricted access to finance. These factors can reinforce one another and make sustained economic growth more difficult.
Why are most of the poorest countries in Africa?
Many of the world’s lowest-income countries are in Sub-Saharan Africa, but poverty is not limited to Africa. Historical factors, conflict, infrastructure gaps, low agricultural productivity, limited access to finance, climate pressures, and rapid population growth have affected development in several African economies. Countries in Asia, the Middle East, and other regions also experience severe poverty.
What causes poverty in developing countries?
Poverty usually results from multiple economic and social factors rather than one cause. Common contributors include unemployment, low wages, limited education, poor healthcare, weak infrastructure, inequality, conflict, inadequate investment, climate-related disasters, and limited access to financial services.
Does GDP per capita measure poverty?
No. GDP per capita measures average economic output per person rather than directly measuring poverty. A country can have a particular GDP per capita while still experiencing significant inequality or shortages in healthcare, education, housing, and basic services. Poverty rates and multidimensional indicators are therefore useful alongside GDP.
How many people live in extreme poverty?
The number changes as new household surveys and estimates become available. The World Bank’s international poverty estimates show that hundreds of millions of people worldwide continue to live in extreme poverty, particularly in Sub-Saharan Africa and fragile or conflict-affected settings. The exact figure depends on the poverty line, PPP methodology, reference year, and latest available data.
Which country has the most people in poverty?
The answer depends on whether poverty is measured by the number of people or the percentage of the population. Large countries can have the greatest number of people living in poverty even when their poverty rate is not the world’s highest. Countries with smaller populations can have much higher poverty rates while having fewer people affected overall.

Stoke is a passionate writer and researcher focused on the world’s richest countries, global wealth, economies, and country rankings. He creates clear, easy-to-understand content to help readers explore global economic trends.